
8 Capabilities to Look for in a Cold Chain 3PL – Infographic
As a food brand expands into more customers, regions, SKUs, and retail requirements, a basic warehouse-and-carrier model can become difficult to manage. This infographic would provide an executive checklist for evaluating a cold chain 3PL built to support growth.

How Retail LTL Consolidation Works in the Cold Chain
Retail LTL consolidation brings compatible frozen and refrigerated shipments together into planned, temperature-controlled loads. The goal is to move smaller orders more efficiently while maintaining the visibility, timing, and product protection retailers require.
7 Cold Chain Issues That Can Trigger a Rejected Shipment- Infographic
Cold chain rejections are not caused by temperature problems alone. This infographic would show the major operational and compliance failures that can prevent frozen and refrigerated products from being accepted at receiving.

Why Refrigerated LTL Shipments Face Higher Damage Risk- Infographic
This infographic explains why frozen and refrigerated LTL freight is more vulnerable to damage than direct full truckload shipments. It highlights how multiple transfer points, handling events, and temperature-controlled environments increase pressure on packaging and pallet stability.

The Cold Chain LTL Freight Problem Map- infographic
This infographic shows why refrigerated and frozen LTL truck freight becomes costly and complex as food brands expand into multiple regional markets. It highlights the operational friction created by small shipments, fragmented routing, and repeated transfers.

The Cost-to-Serve Formula for Frozen LTL Distribution- Infographic
This infographic explains how cost-to-serve analysis helps food brands understand the full operational cost of moving frozen and refrigerated products through the cold chain, beyond freight invoices alone. It shows how transportation, storage, handling, delivery requirements, and customer complexity all affect the true cost of service.

How CORE X Delivers Unified Supply Chain Visibility – Infographic
This infographic explains CORE X’s approach to connecting storage, transportation, and reporting within one operational framework. It highlights how standardized data structures and centralized reporting support visibility across a nationwide cold chain network.

Cold Chain LTL vs. Traditional LTL – Infographic
This infographic compares standard LTL shipping with cold chain LTL consolidation, showing why temperature-sensitive freight needs a more controlled process than general freight.

Network-Wide Compliance: How Core X Partners Supports BRCGS Certification Across Locations- Infographic
Showcase what it takes to sustain certification across multiple sites: centralized oversight, standardized documentation, and consistent execution at the facility level.

How CORE X Partners Runs a Coordinated National Cold-Chain Network- Infographic
Turn CORE X’s operating model into a clear, visual flow: centralized oversight for consistency, executed locally through Partnering Regional Operators (PROs). This infographic is designed for sales enablement and “how we work” explainers.
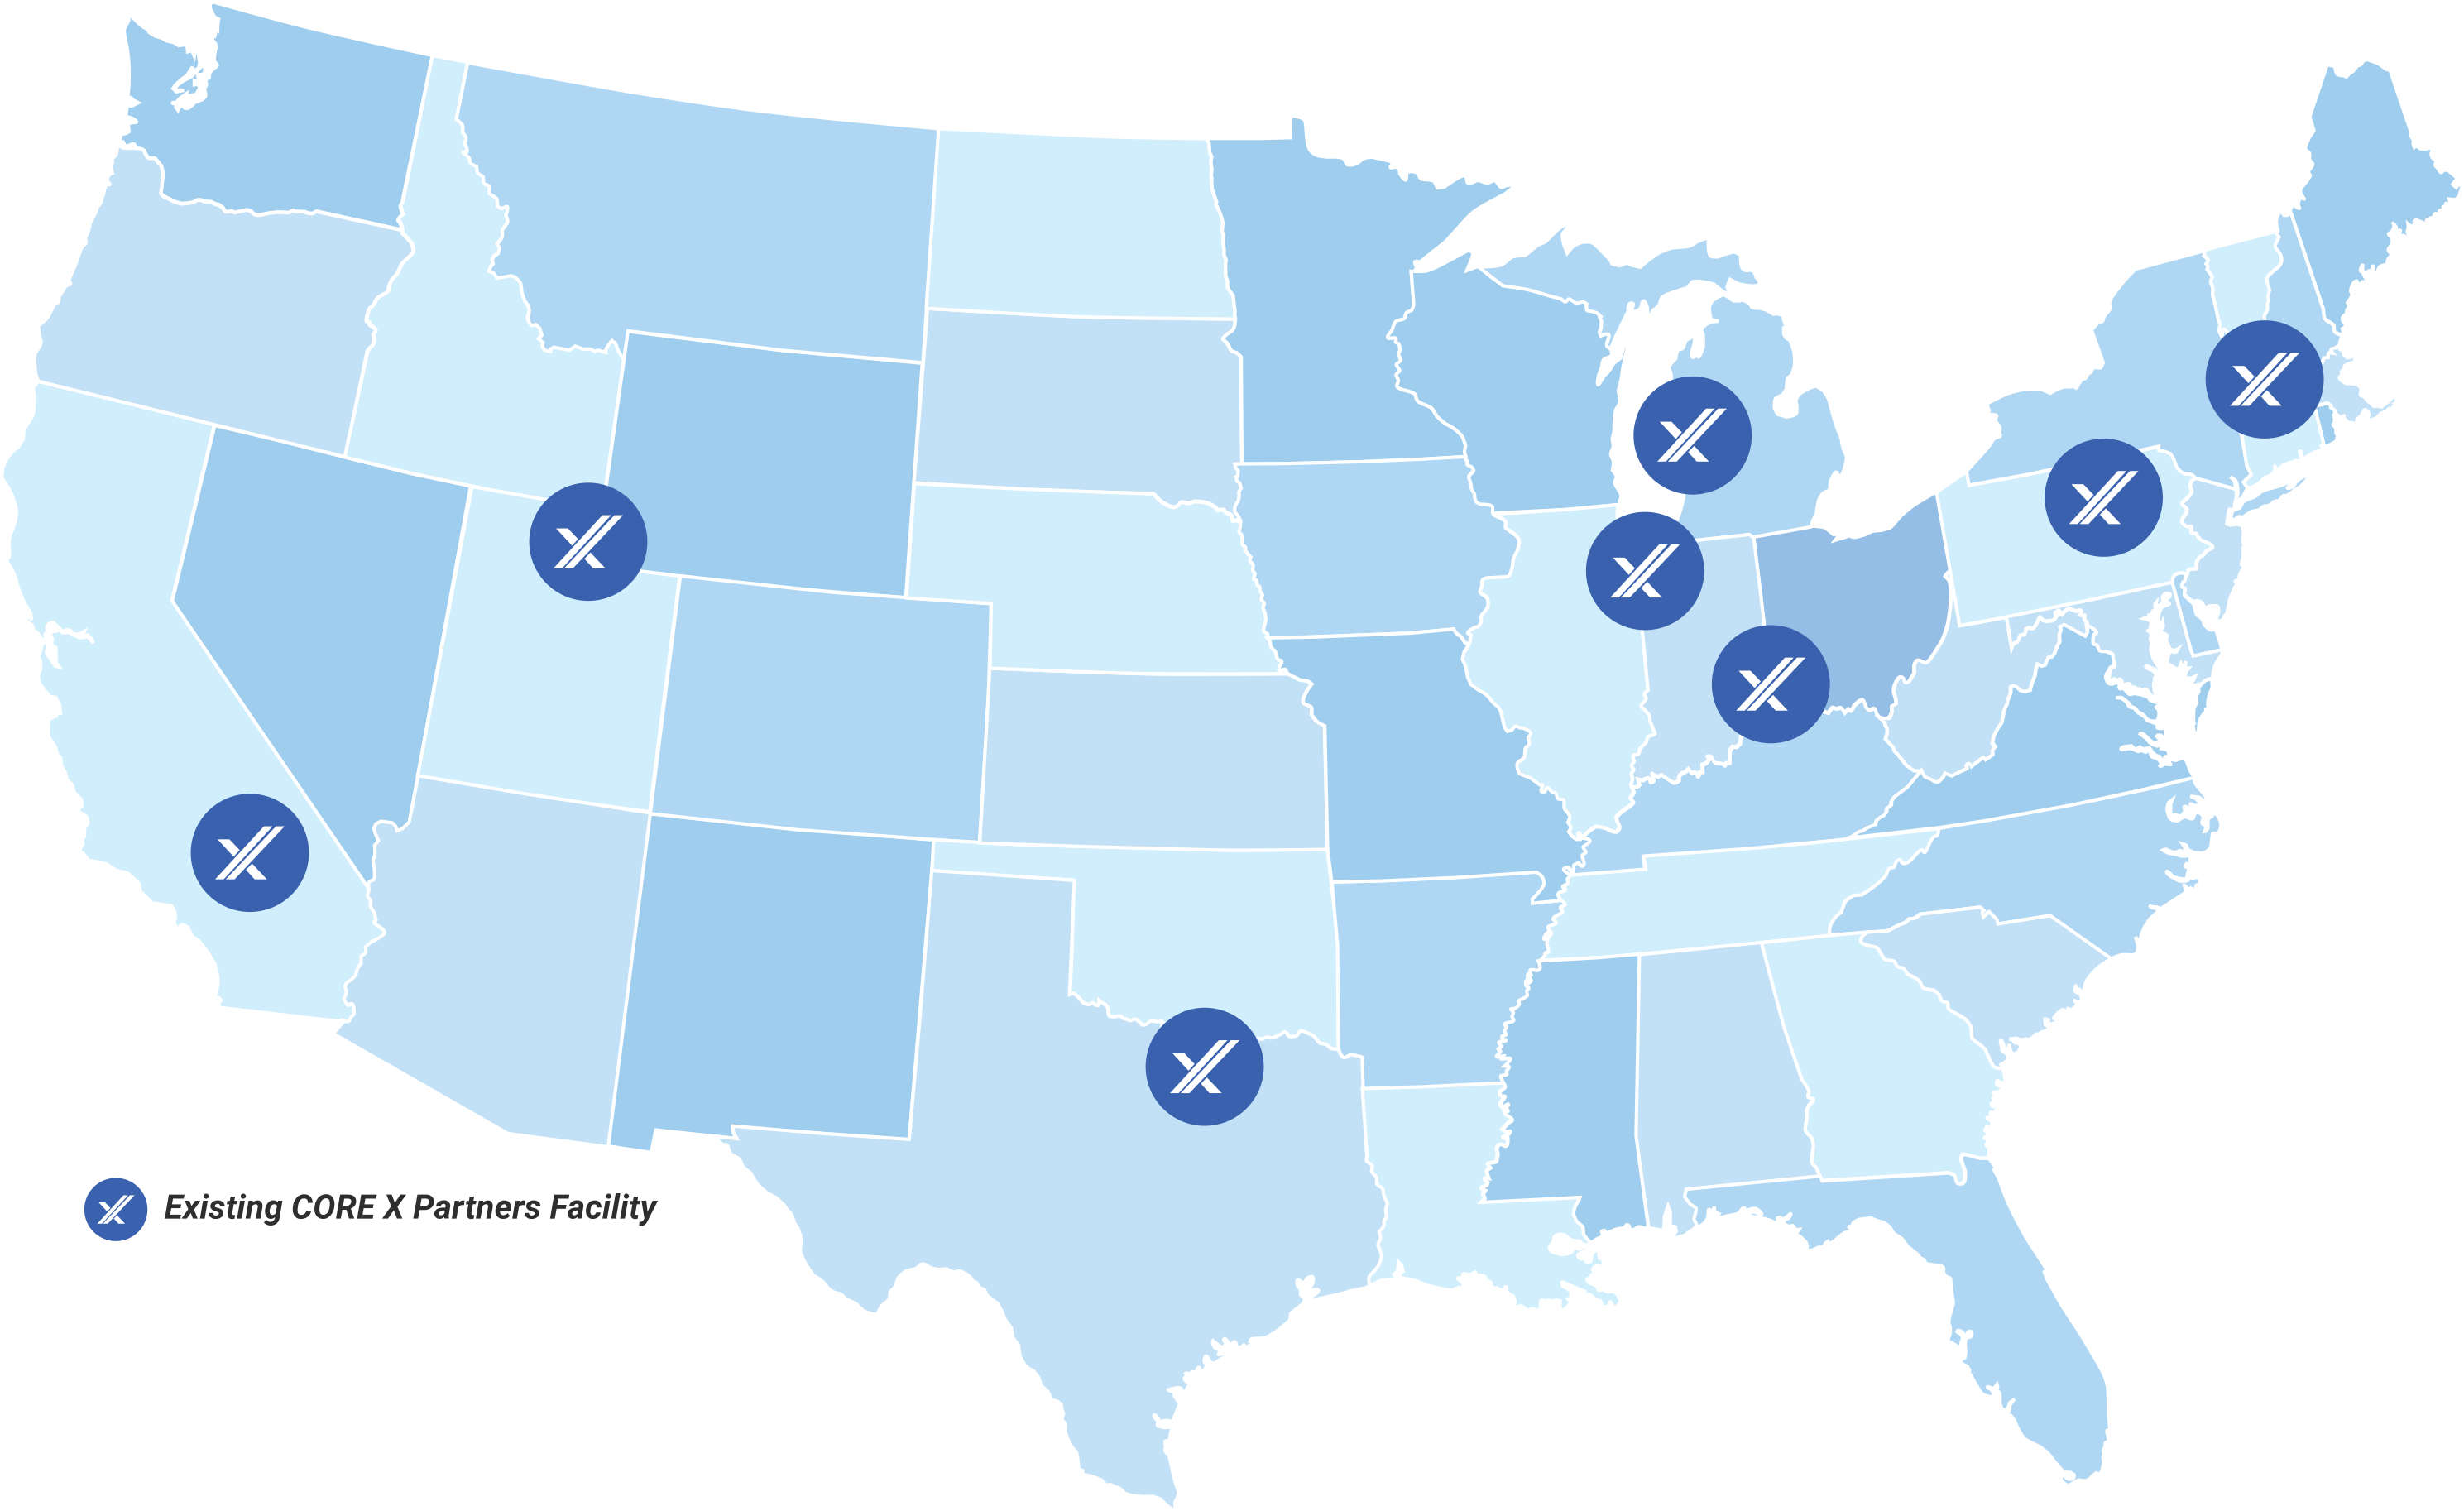
Find a Facility