A frozen freight temperature excursion does not have to end in a rejected load to cost the business money.
A shipment may still be accepted after review, but the event can create inspection work, product holds, customer questions, delayed inventory availability, additional documentation, and internal follow-up. If the same problem appears repeatedly, the cost extends beyond one load and starts affecting margins, service performance, and customer confidence.
That is why temperature integrity should be evaluated as both an operating and financial issue.
CORE X Partners helps food manufacturers connect cold chain visibility with transportation planning, carrier performance, temperature-controlled storage, and regional operating support so temperature events can be identified, reviewed, and addressed before the same problems repeat.
Temperature Instability Creates Cost Before Product Is Lost
The most visible result of a serious temperature problem is a rejected or damaged load. That is also the easiest cost to recognize.
Many temperature events create smaller costs first. Quality teams may need to review temperature history. Product may be placed on hold. Customer service may need to coordinate updates. Warehouse teams may need to separate inventory while a disposition decision is made.
Product quality can also be affected even when the load is not rejected. Repeated temperature instability can contribute to changes in product condition, texture, frost, and moisture behavior. An accepted load has not necessarily performed well from a quality standpoint.
The better question is not only whether the shipment was accepted. It is what the event cost and whether the same issue is likely to happen again.
Measure the Events That Drive Frozen Freight Cost
A useful KPI program should connect temperature performance to service and financial outcomes. The strongest measures show how often events occur, how serious they are, how quickly teams respond, and whether the same root causes keep returning.
Temperature-Event Frequency
Start by measuring how often temperature events occur. A manufacturer might track events per 100 shipments or use another consistent denominator that fits its freight volume. The exact calculation is less important than using the same method over time.
The data should also be segmented by carrier, lane, facility, season, trailer type, or customer. A single network-wide average can hide important patterns.
If one carrier shows repeated events, the issue may involve equipment or operating discipline. If one lane performs poorly, the cause may be dwell, route conditions, or delivery timing. If one facility shows the same pattern, staging or loading practices may need review.
Duration and Severity of Excursions
Not every excursion should be treated the same way. A brief temperature change during a controlled door opening is different from a sustained drift caused by refrigeration failure. Manufacturers should evaluate both the magnitude of the event and how long it lasted.
The review should follow product-specific requirements rather than one universal threshold. Depending on the shipment, teams may look at peak temperature, duration outside specification, recovery time, and whether the event occurred once or repeatedly.
This helps separate minor operating variation from a meaningful quality risk.
Alarm-Response Time
Detection only helps if someone acts on it. Operations teams should measure how long it takes to acknowledge an alarm and how long it takes to begin corrective action. Those are different measurements.
A temperature alert may be acknowledged quickly but still remain unresolved while the team decides what to do. A stronger process tracks both the initial response and the time required to begin recovery.
Corrective action may include contacting the driver, checking reefer status, arranging repair support, diverting the load, or moving product into temperature-controlled storage.
Speak With A Cold Chain Specialist
Connect Temperature Events to Claims and Customer Impact
Temperature events become easier to prioritize when they are tied directly to what happens next.
Claims and Rejected Loads
Claims and rejected loads show the clearest financial impact.Manufacturers should track whether temperature events lead to product claims, replacement inventory, disposal, expedited freight, customer credits, or service deductions.
Those costs should then be compared with the original freight decision.
A lower linehaul rate can lose its advantage quickly if the same carrier or lane creates repeated claims or recovery expense.
Product Holds and Delayed Availability
Not every shipment is rejected immediately. Some loads may be held while quality teams review temperature data, product condition, and event history. During that time, inventory may be physically present but unavailable for sale or replenishment.
That can create secondary costs. A retailer may need another shipment. Customer service may need to explain a delay. Production planning may need to replace inventory earlier than expected.
These costs are less visible than a formal claim, but they still affect the business.
Customer Service and Internal Labor
Temperature events also consume time. Quality, transportation, warehouse, customer service, and finance teams may all become involved in one shipment review. Documents have to be collected. Carrier responses need to be reviewed. Customers need updates.
That internal labor rarely appears on the freight invoice. For mid-size manufacturers with lean teams, repeated exceptions can create a significant administrative burden even when product loss is relatively low.
Track Dock Dwell and Handoff Time
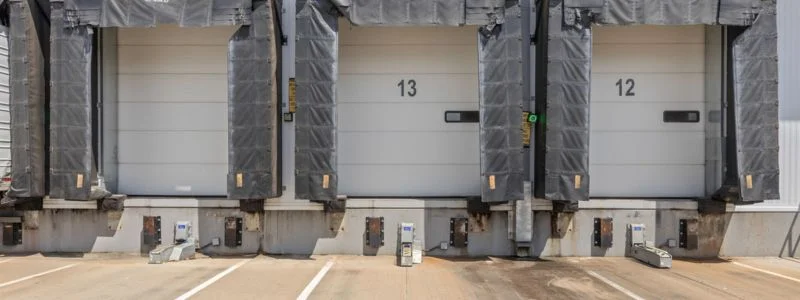
Temperature risk does not begin when the trailer reaches the highway. Product may spend time staged at the warehouse, waiting for a trailer, sitting through a cross-dock, or remaining at a receiving facility while an appointment is resolved. Those handoffs can create additional exposure and delay.
Dock dwell is therefore an important supporting KPI. Manufacturers should look at time from staging to loading, trailer wait time, loading duration, cross-dock dwell, and time between arrival and unloading. Long dwell does not automatically mean the product is compromised, but it shows where the cold chain has more exposure opportunity.
If temperature events repeatedly line up with the same handoff or facility, that operating step deserves attention.
Include On-Time Performance in the Temperature Review
A shipment can remain within temperature specification and still create risk if it consistently arrives late. Delays increase transit time, reefer runtime, dwell, and the chance of missing receiving appointments. A late load may also spend additional time waiting before unloading.
That is why On-Time, In-Full (OTIF) performance should be reviewed alongside temperature events. A carrier with stable temperature performance but frequent appointment failures may still increase operating risk. Another may deliver on time but show repeated temperature alarms that require extra investigation.
Both patterns matter.
Measure Cost per Successful Delivery
Freight cost alone does not show what a shipment really costs. A more useful view is cost per successful delivery.
That calculation may include:
Freight cost + claims + accessorials + disposal + replacement freight + internal intervention
The exact formula will vary by company, but the principle is simple: include the costs created when the shipment does not move cleanly from origin to customer.
For example, assume Carrier A saves $150 per load compared with Carrier B. Across 100 shipments, that appears to create $15,000 in savings.
If one rejected frozen load then creates $25,000 in product, replacement freight, and customer-related cost, the apparent savings disappears.
Those numbers are examples, not industry benchmarks. The point is to compare modest rate savings with the real cost of failure.
CORE X discusses controlling cold chain transportation costs by looking beyond linehaul alone.
Speak With A Cold Chain Specialist
Build a Monthly Cold Chain Performance Review
Temperature data has more value when it is reviewed consistently. A monthly review can bring transportation, warehouse, quality, and customer-service teams together around the same operating information.
A practical scorecard may include:
| KPI | What to Review |
| Temperature-event frequency | Which carriers, lanes, or facilities show the most events |
| Excursion duration | How long events last and whether severity is changing |
| Alarm-response time | How quickly teams acknowledge and act |
| Claims and rejected loads | Financial impact of temperature failures |
| Dock dwell | Where handoffs create unnecessary exposure |
| OTIF performance | Whether delays are increasing risk |
| Cost per successful delivery | True transportation cost after exceptions |
These measures are most useful when reviewed as trends rather than isolated monthly totals.
The key question is whether the same cause keeps appearing.
Use Root-Cause Trends to Prevent the Next Excursion
Once temperature events are visible, the next step is prevention.
Recurring problems may point to poor trailer pre-cooling, restricted airflow, excessive dock dwell, reefer maintenance issues, repeated door openings, weak alarm escalation, a problem carrier, or a difficult lane.
Each root cause requires a different response.
A loading issue may call for a revised pallet pattern. A carrier issue may require a different allocation strategy. A lane problem may justify another facility or transportation model. Excessive dwell may require changes to staging or appointment planning.
That is where cold chain KPIs and visibility become useful operating tools instead of reporting exercises.
Use the Data to Improve the Network
Temperature-event data should eventually influence broader cold chain decisions.
If one lane repeatedly produces long dwell and temperature instability, inventory may need to be positioned differently. If one carrier performs poorly during peak season, freight allocation may need to change. If consolidation creates too many handling points for one product, the transportation mode may need to be reconsidered.
For Less-Than-Truckload (LTL) freight, a frozen LTL cost-to-serve review can help connect transportation cost with handling, dwell, claims, and service performance.
This frozen freight quality case study shows how dedicated frozen warehousing, temperature monitoring, standardized workflows, and multi-facility execution can support long-distance freight.
The larger point is that repeated temperature events should change how the network is managed.
Connect Visibility to Prevention
Temperature monitoring is most valuable when it leads to better decisions.
A dashboard can show where an excursion occurred. Operations teams still need to use that information to improve carrier selection, loading practices, staging, route planning, facility placement, and response procedures.
That is where coordinated cold chain logistics become important.
A problem identified during transportation may actually begin at the dock. A recurring lane issue may point to inventory placement. Slow alarm response may reveal a communication gap instead of an equipment problem.
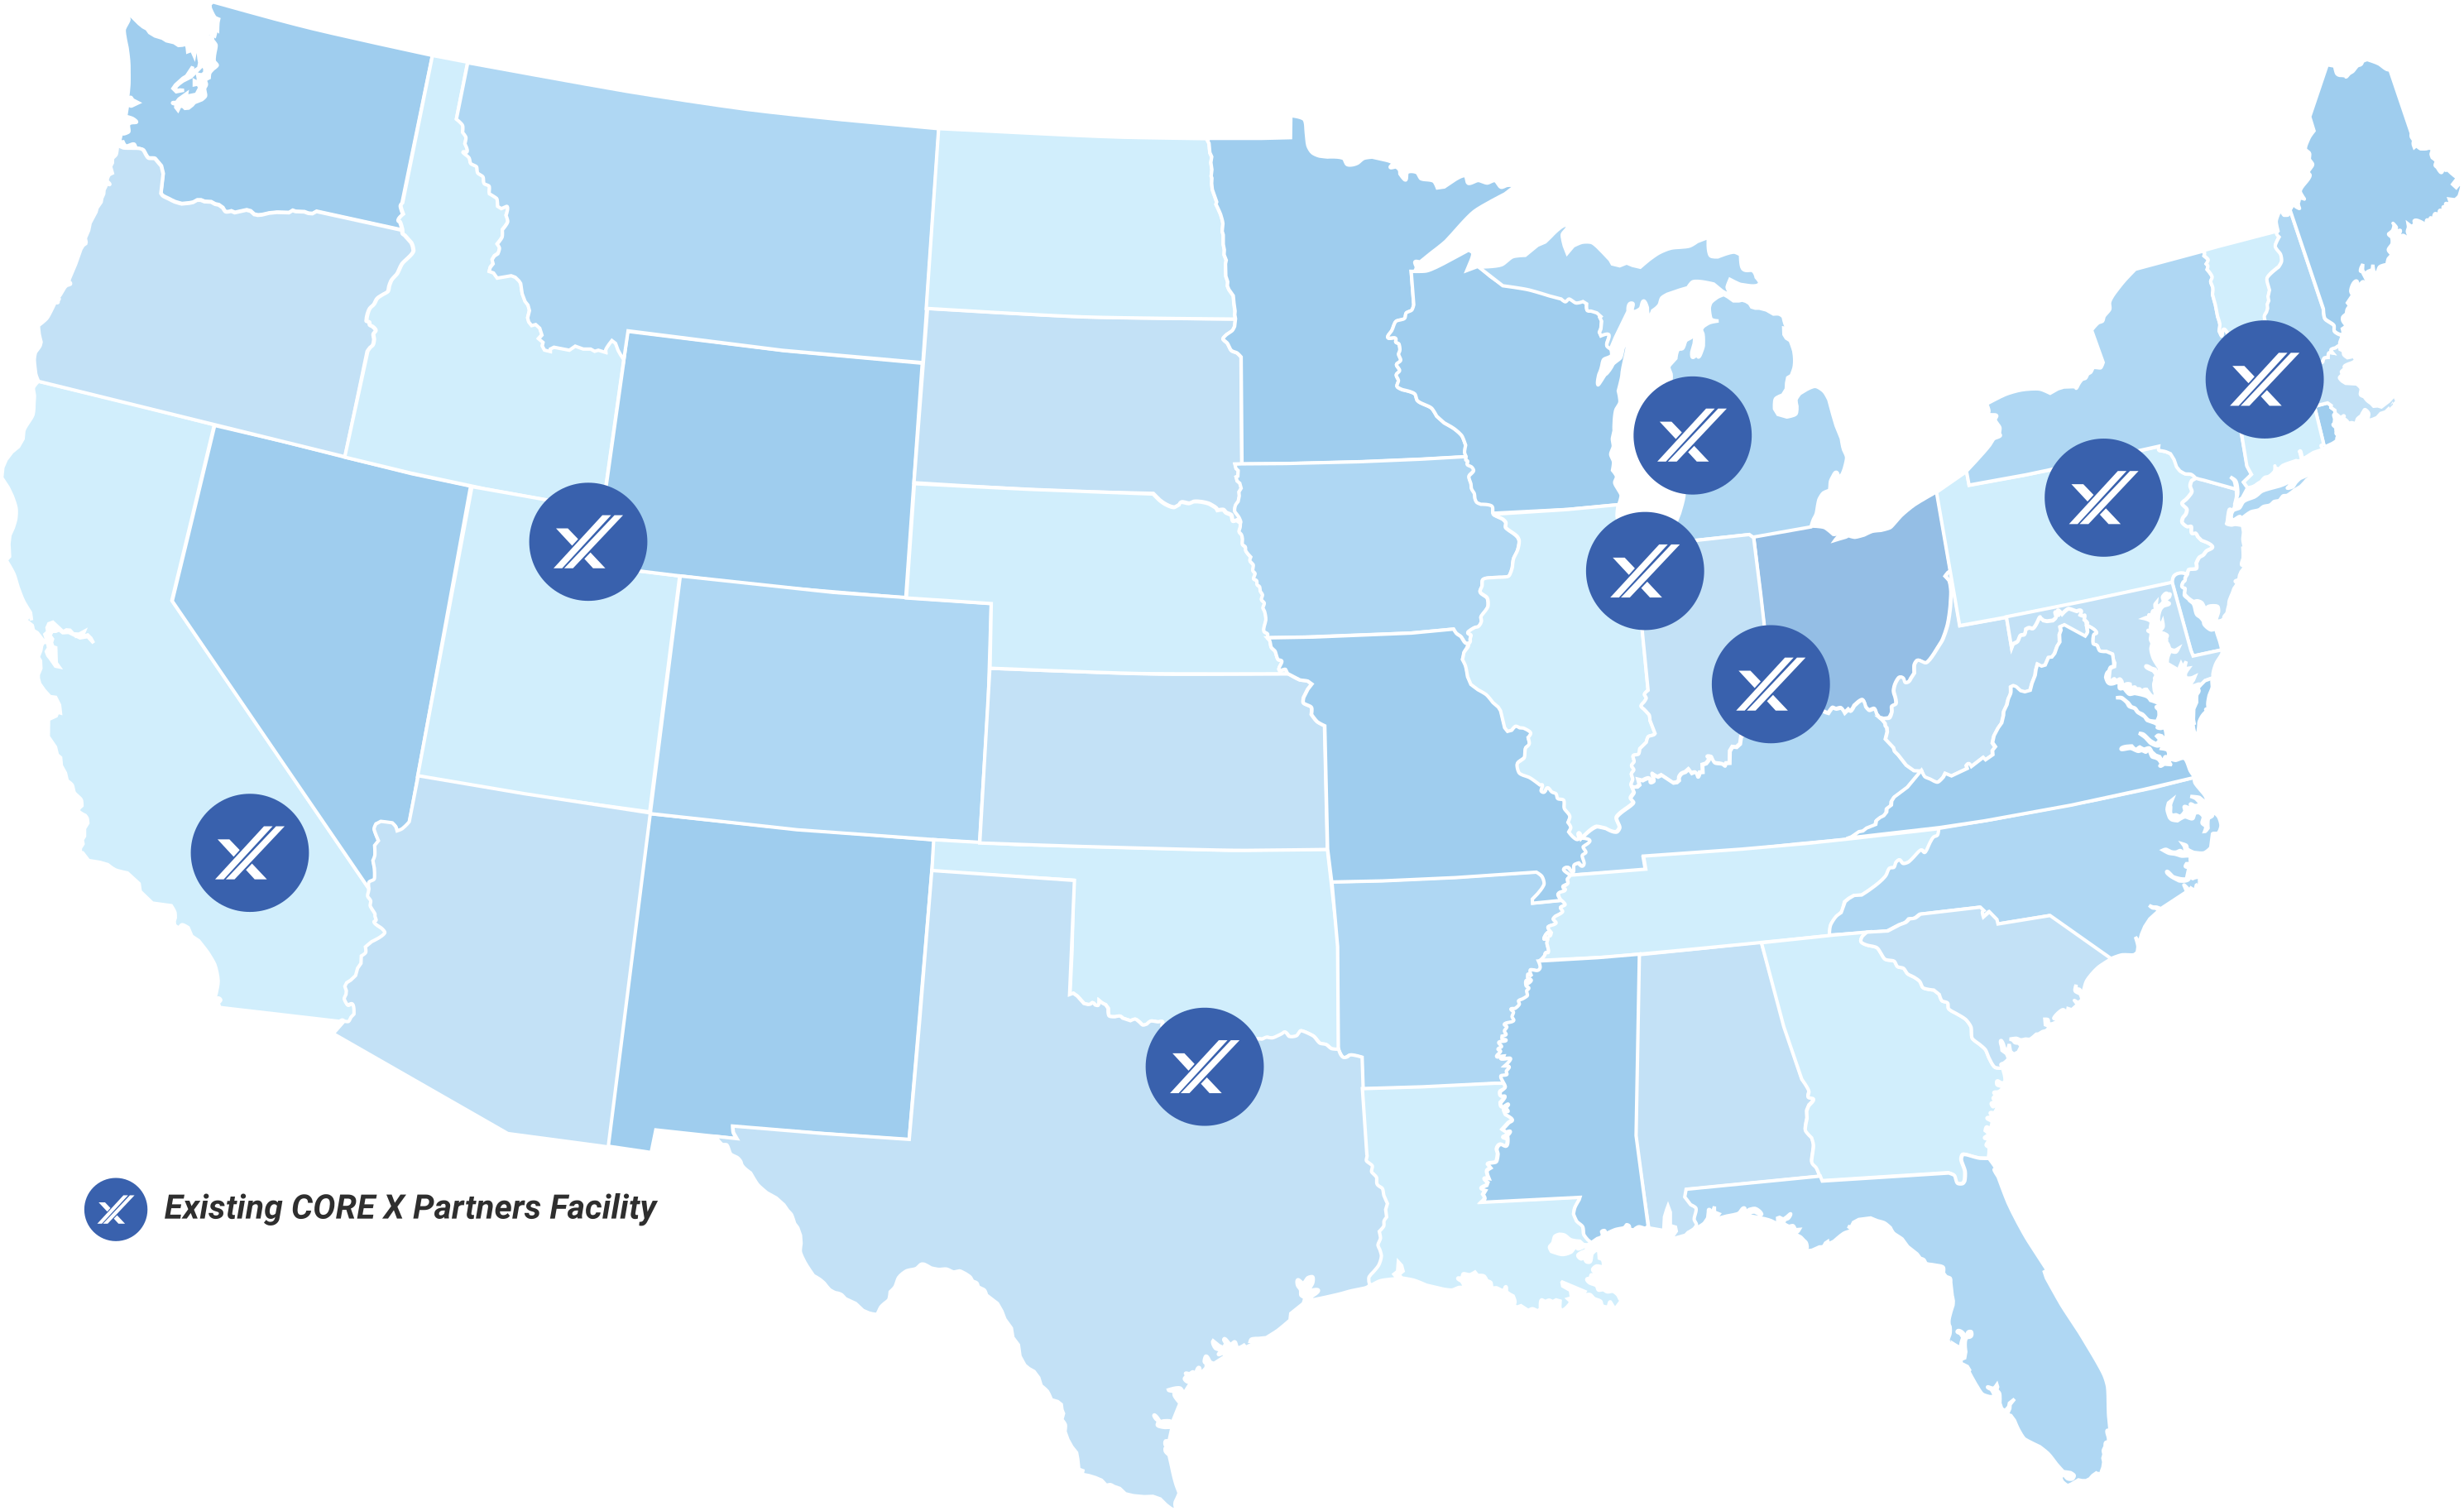
Access to a nationwide cold storage facility network gives food manufacturers more options when a frozen or refrigerated shipment needs temporary storage, cross-docking, or another recovery point. In the Midwest, CORE X CROWN in Crown Point, Indiana is part of that broader regional network, alongside other CORE X facilities serving Midwest distribution.
Measure the Full Cost of Frozen Freight Temperature Excursions
Temperature excursions should not be evaluated only by whether a load was rejected. Their impact can include product holds, inspection work, claims, replacement freight, customer disruption, longer dwell, and hours of internal intervention.
The right KPIs make those costs visible. Event frequency, duration, alarm response, claims, dwell, OTIF, and cost per successful delivery give operations leaders a clearer view of where frozen freight is performing well and where corrective action is needed.
CORE X Partners helps food manufacturers connect temperature visibility with transportation planning, cold storage, carrier performance, and regional operating support. Our teams help customers use shipment data to identify recurring risk and improve how frozen freight moves across the network. Contact CORE X Partners to discuss frozen freight performance, cold chain KPIs, and the cost of temperature excursions.